
Reports and analysis
Since v0.3.8 the web UI answers two questions that the alerts do not: what does the PKI look like over the coming weeks and the past ones, and what looks odd, and why. Reports shows charts of what the server holds. Analysis applies ten fixed rules and writes down what each one saw, why it matters and what you could do. Both are computed on the server from data it already has. Nothing is sent to an outside service and nothing is stored: the pages are calculated again, at most once a minute.
The alerts in Monitoring tell you that something needs action now. These two pages are for looking, for example once a week. This is the condensed version of operations guide chapter 15.
- Who can see it
- The Reports page
- The dashboard charts
- The Analysis page
- REST API
- Why the charts are SVG without JavaScript
- Reading the charts without seeing them
- What it does not do
Who can see it
Both pages, the two charts on the dashboard and the two REST endpoints need the tenant-wide read
permission (pki.read), the same as the Alerts page: a viewer, operator or admin whose role covers
the whole tenant. The reason is what they contain: names of CAs, hosts, ACME accounts, agents and domains of
the whole tenant. There is no per-CA slice of that.
- A user whose role is limited to one CA gets the 403 page, has no Reports or Analysis entry in the menu and sees no charts on the dashboard.
- An API token follows the same rule: a token whose role covers the tenant can read both endpoints, a
token whose roles are limited to one CA gets
403. - Both pages and both endpoints work while the server is sealed, because they only read.
- The pages change nothing. There is nothing to confirm and no second factor is asked.
The Reports page
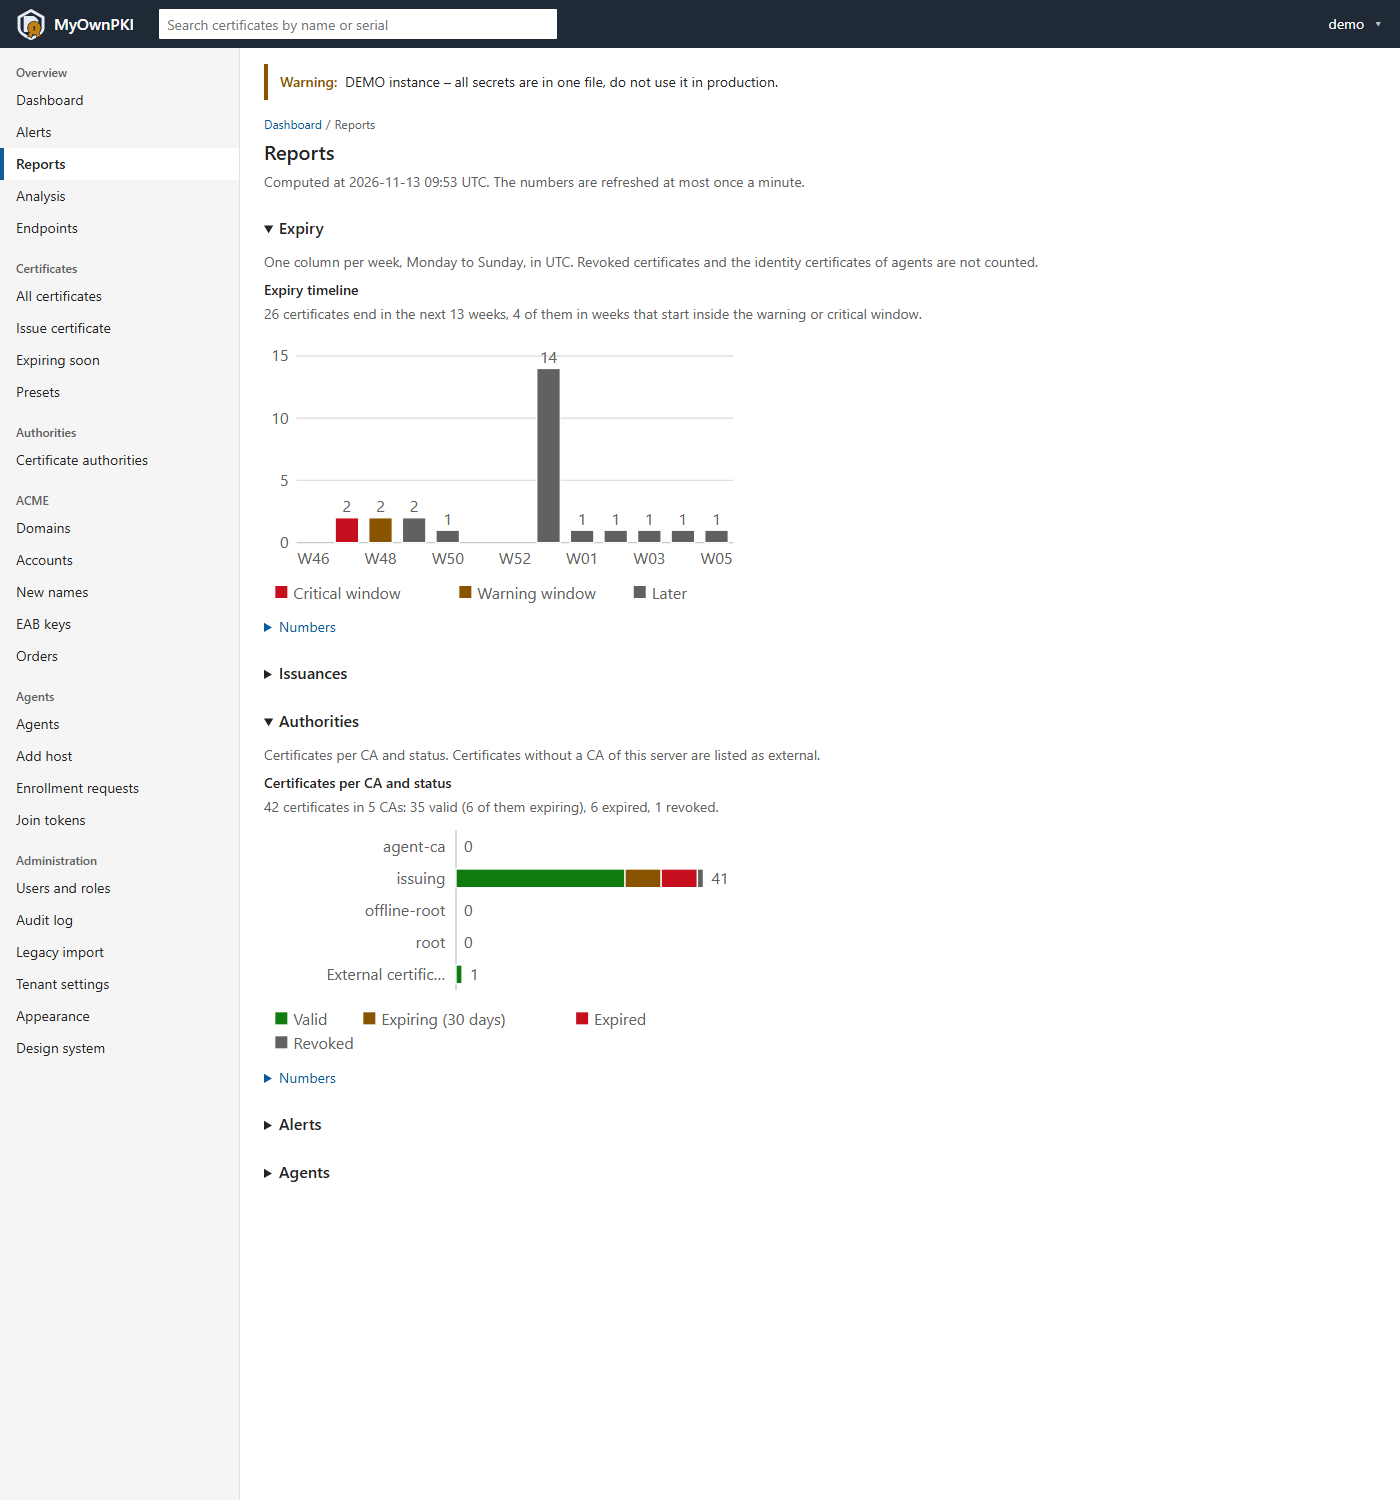
Reports is under Overview, between Alerts and Analysis. It has five sections. Each section is a fold
(a <details> element: click the heading, or focus it and press Enter or Space). Expiry and Authorities
are open, Issuances, Alerts and Agents are closed, and the page does not remember what you opened.
Under each heading a plain sentence says what is counted and what is left out. Then come the chart, a
summary sentence and, in a closed Numbers fold, the same figures as a table.
The top of the page says when the numbers were computed (“Computed at … UTC”). All weeks are ISO weeks in
UTC: they start on Monday at 00:00 and end on Sunday, whatever your own time zone is. The labels are week
numbers such as W47; the table spells out the year and the Monday, for example 2026-W47, week of
2026-11-16. A week without data is shown as an empty column or a zero, never left out. A section with
nothing to count shows one sentence instead of a chart, for example There are no certificates yet., and
has no table.
One report per tenant, built at most once a minute. Everybody who may read it sees the same numbers until the minute is over. A reload within the minute changes nothing, and what you did a few seconds ago (issuing, revoking) shows after the next build. A minute is also the period of the monitor.
Expiry
Expiry timeline: one column for each of 13 weeks, the current week and the 12 after it. The first column counts only certificates that end after now.
- Counted: every certificate that is not revoked, whatever its source (issued here, imported or external). Left out: revoked certificates and the identity certificates of agents.
- Colors: a column is in the critical window when its week starts inside the critical expiry limit of
the monitor, counted from now, and in the warning window when it starts inside the warning limit. These
are the limits of
monitor.expiry_days, by default 3 and 14 days; the current week starts at the moment of the build. Later weeks are Later, in a neutral color. The table repeats the window as text in a Window column, so color is never the only information. - Reading it: a tall column a few weeks out is an expiry wave: many certificates ending together,
which is a risk when their renewals fail together (the analysis names such a week). The
chart counts every certificate that ends, also one that a newer certificate for the same names replaces
already. The
cert_expiryalert is different: it opens only when nothing newer covers the names.
The certificates of the dashboard’s table Expiring in the next 30 days are among the ones this chart counts.
Issuances
Issuances per week: the last 12 weeks, the current one included, stacked by source. A certificate counts in the week in which it was created.
| Source | A certificate counts here when |
|---|---|
| ACME | an ACME order produced it and the order’s ACME account is not linked to an agent |
| Agent | an ACME order produced it and the account belongs to an agent (the agent uses ACME inside) |
| UI and API | no ACME order points at it: it was issued in the web UI or with the REST API |
- Counted: certificates this server issued. Left out: imported and external certificates (they are not issuances) and the identity certificates of agents.
- The server has no field that records how a certificate was requested. The source is derived from the ACME orders, which is why there are these three classes and the UI and the API cannot be told apart.
- The series differ by a pattern as well as by color, so a printout in black and white stays readable.
Authorities
Certificates per CA and status: one horizontal bar per CA, stacked by valid, expiring (valid, and ending within 30 days), expired and revoked. Certificates that have no CA of this server are listed as one more entry, External certificates, at the end.
- A CA without certificates is listed only while it is active.
- The identity certificates of agents are not counted. The Certificates page hides them by default too, so
its status filters (
valid,expired,revoked) can be compared with this chart.
Alerts
Alerts opened per week: the current week and the four before it, stacked by warning and critical. An alert counts in the week in which it opened, with the severity it has now. The sentence under the chart also says how many alerts are open right now. The server keeps resolved alerts for 30 days, so that is all the history there is. It is the history of the alerts of monitoring and includes the TLS scan alerts.
Agents
Only shown when the agent listener is on. Three small bar charts:
| Chart | Bars |
|---|---|
| Agents by state | Active, Silent (warning), Silent (critical), Disabled, Revoked |
| Agent versions compared with the server | Current or newer, Older, Unknown |
| Deployments by state | Deployed, Pending, Failed, Rolled back |
- Silent uses the same limits as the
agent_silentalert (one hour for a warning, 24 hours for critical, by default). An agent that has never reported counts as Active, as it does in the monitor. - The version and deployment charts count the agents that are neither disabled nor revoked. Unknown is an agent whose version is not a release number, or any agent while the server is a development build. A deployment that was removed is not counted.
The dashboard charts
For a role that may read the reports, the dashboard has two of the charts, Expiry and Authorities, below the table of certificates that expire in 30 days. Each is in an open fold, and a link, All reports, leads to the Reports page. For other roles the dashboard is unchanged. If the report cannot be built, the dashboard says so in one line and everything else on it still works; the cause is in the server log.
The Analysis page
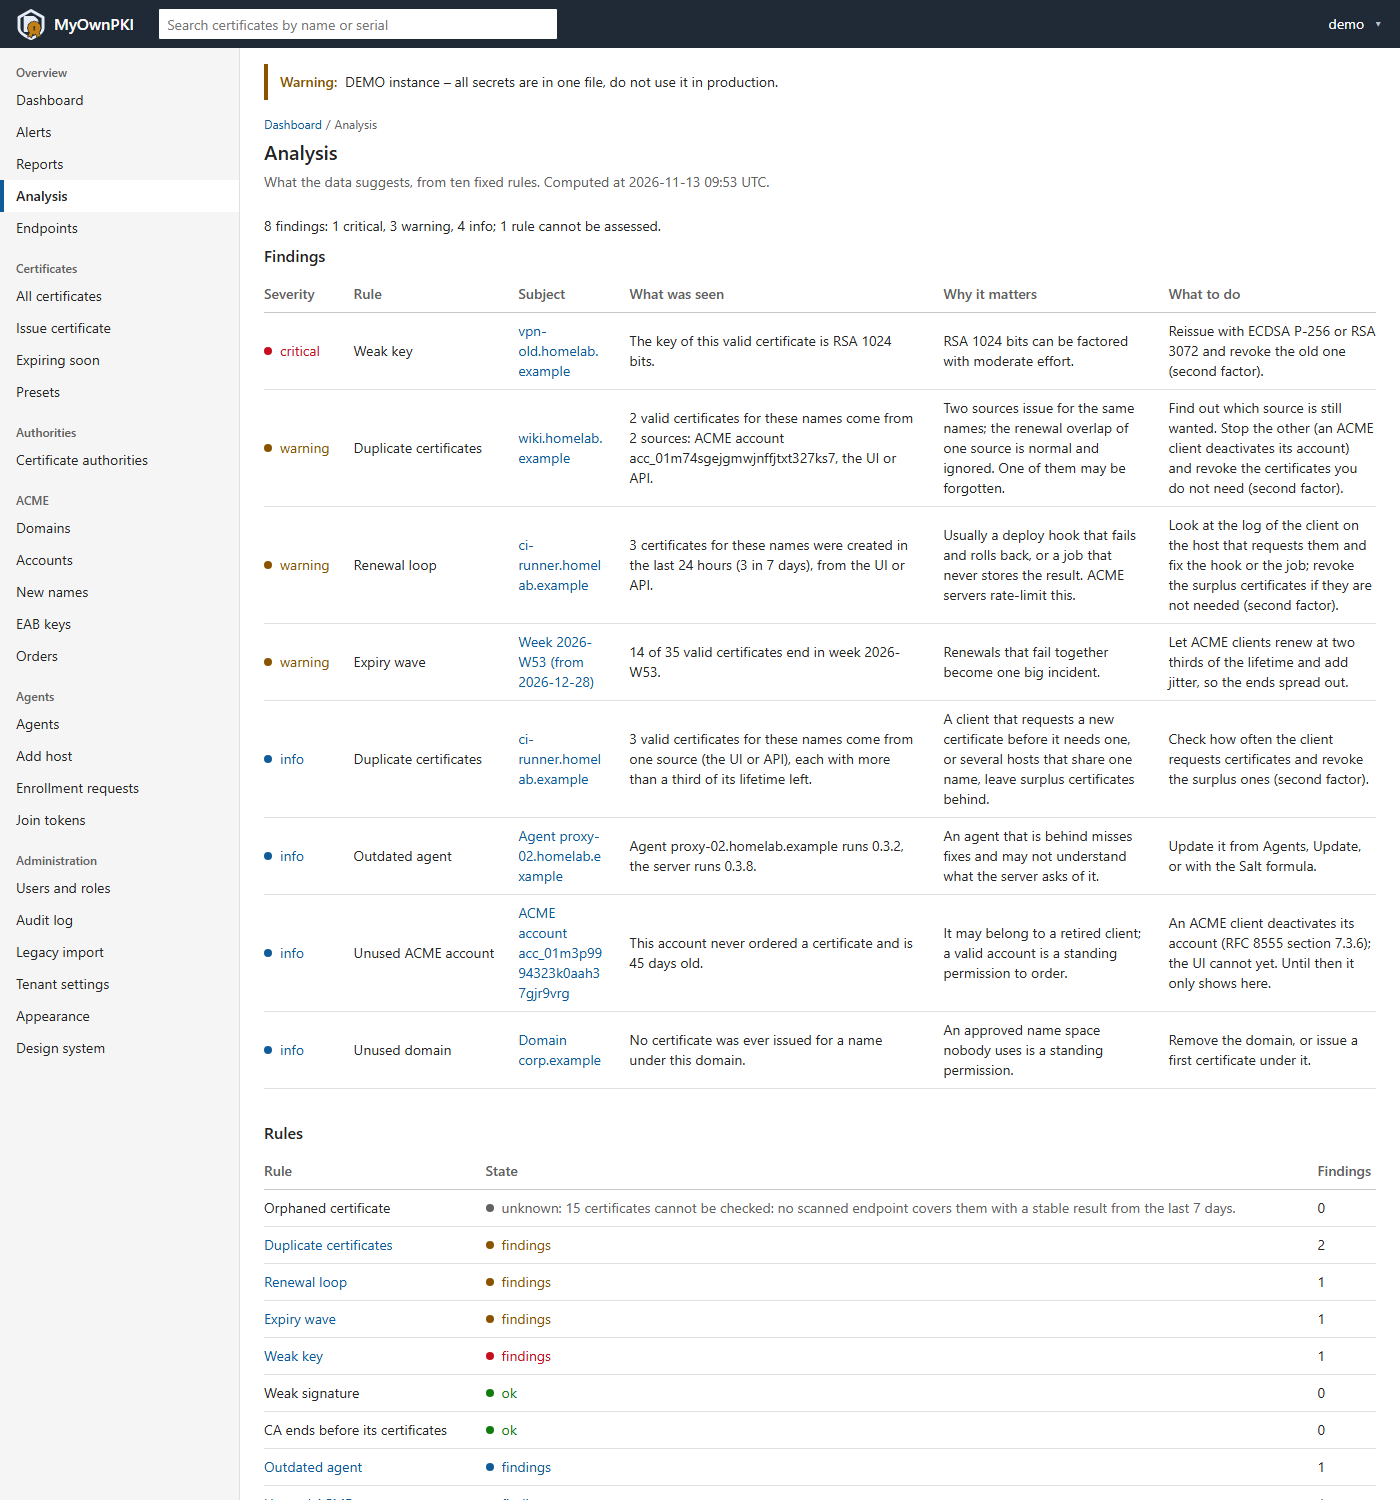
Analysis is the next entry under Overview. From top to bottom:
- A summary line, for example 8 findings: 1 critical, 3 warning, 4 info; 1 rule cannot be assessed.
- Findings: a table with Severity, Rule, Subject (a link to the certificate, CA, agent, domain or account when the UI has a page for it), What was seen, Why it matters and What to do. The most severe come first. A finding says only what the data shows: it says that no scanned endpoint served a certificate, never that the certificate is unused.
- Rules: all ten, with their state and the number of findings. A rule with findings links to
?rule=<id>, which limits the findings table to that rule (Show all findings goes back). - How this works: a short explanation.
The analysis is advice, not an alarm. It raises no alert, sends no e-mail or webhook and stores nothing. It cannot be dismissed or acknowledged; a finding disappears when its cause does, at the next computation. The thresholds are constants in the program, not settings. They are defaults chosen without long experience, so judge the findings against your own installation. The page keeps at most 200 findings per rule and counts the rest.
The ten rules
The ids are stable and appear in the REST API.
| Rule | It looks for | Thresholds | Severity | What the finding suggests |
|---|---|---|---|---|
orphaned_certificate |
A current valid certificate that no agent reports as deployed and that no scanned endpoint serves, although endpoints that cover its names were scanned | The certificate is at least 14 days old; a covering endpoint was scanned successfully in the last 7 days and has served another certificate for at least 7 days | info | Check the host, then revoke the certificate if it is not needed (second factor) |
duplicate_certificates |
Valid certificates issued here for exactly the same names, from different sources or in surplus from one | Each has more than a third of its lifetime left, so the overlap of a renewal does not count; two or more sources is a warning, three or more from one source is info | warning, info | Find out which source is still wanted, stop the other, revoke the surplus (second factor) |
renewal_loop |
A client that keeps getting certificates for the same names, whatever the status of the earlier ones | 3 or more in 24 hours (warning), 6 or more in 24 hours (critical), 8 or more in 7 days (warning) | warning, critical | Read the log of the client on the host: a deploy hook that fails and rolls back, or a job that never stores the result |
expiry_wave |
One week in which many of the valid certificates end | At least 10 certificates in the week and at least 30 percent of all valid certificates; the tenant needs at least 20 valid certificates | warning | Let ACME clients renew at two thirds of the lifetime and add jitter, so the ends spread out |
weak_key |
A valid certificate with an RSA key shorter than 2048 bits | RSA 2048 is not flagged | critical | Reissue with ECDSA P-256 or RSA 3072 and revoke the old one (second factor) |
weak_signature |
A valid certificate, or the certificate of a current intermediate CA, signed with SHA-1, MD5 or MD2 | The signature of a root is not judged | critical | Reissue from a CA that signs with SHA-256 or better, or renew the CA below such a root |
ca_cliff |
An issuing CA whose current certificate ends sooner than the default validity of the certificates it issues | The default is the longest validity_days of the CA’s domains, 90 days without a domain; critical when less than 14 days are left or the CA has ended |
warning, critical | Renew the CA first (second factor). The ca_expiry alert stays the alarm |
outdated_agent |
An active agent older than the server | A different major or minor version is a warning, a patch release behind is info | warning, info | Update it from Agents, Update, or with the Salt formula |
unused_acme_account |
A valid ACME account that is not an agent’s and has not ordered for a long time | At least 30 days old, and no order for 90 days or none ever | info | An ACME client deactivates its account (RFC 8555, section 7.3.6); the UI cannot yet |
unused_domain |
A domain under which no certificate was ever issued | At least 30 days old; a certificate of any status counts as use | info | Remove the domain, or issue a first certificate under it |
ca_cliff exists because the engine shortens a default validity to the end of the CA and refuses a longer
explicit request: when a CA ends in 60 days, every certificate it issues from now on ends then at the
latest. weak_key and weak_signature typically find certificates that came in from outside, an import from
pki.sh or an external certificate.
The three states
Every rule has exactly one state:
| State | Meaning |
|---|---|
ok |
The rule had data and found nothing |
findings |
The rule found something. If it could not judge a part of its input, the state still reads findings and adds N not assessed with the reason |
unknown |
The rule cannot say, because its input is missing; the reason is shown |
unknown is not a problem. It means the data to judge is not there, and the rule refuses to guess; it
never produces a finding. The usual reasons:
| Rule | Unknown when |
|---|---|
orphaned_certificate |
the TLS scan is off; or some certificates are not covered by an endpoint with a stable scan result from the last 7 days (the reason says how many) |
duplicate_certificates |
the source of some certificates in a group of the same names is not known |
expiry_wave |
the tenant has fewer than 20 valid certificates |
weak_key, weak_signature |
the key size or the signature algorithm of a certificate cannot be read |
ca_cliff |
an issuing CA has no signed certificate yet |
outdated_agent |
the agent listener is off, the server is a development build, or an agent reports a version that is not a release number |
An installation with the TLS scan switched off sees unknown for orphaned_certificate all the time, and a
small one also for expiry_wave. That is correct. Add the hosts that matter to the
TLS scan and the first rule starts to judge the certificates they cover.
renewal_loop, unused_acme_account and unused_domain never answer unknown.
REST API
Both endpoints are GET, need the permission of Who can see it and answer
Cache-Control: no-store. The result is the cached one the pages use, so generated_at can be up to a minute
old. All times are RFC 3339 in UTC, and every string is plain text, never HTML: whoever shows a certificate
or CA name has to escape it.
| Endpoint | Returns |
|---|---|
GET /api/v1/reports |
generated_at, expiry.weeks[] (start, count, window: critical, warning or none), issuances.weeks[] (start, acme, agent, ui), authorities[] (id, name, valid, expiring, expired, revoked), alerts (retention_days, weeks[], open) and agents (null while the agent listener is off) |
GET /api/v1/analysis |
generated_at, summary (critical, warning, info, unknown), rules[] (id, title, state, count, unknown_reason) and findings[] (key, rule, severity, subject, seen, why, recommendation, href) |
GET /api/v1/analysis?rule=weak_key |
the same for one rule; the summary then covers that rule only |
authorities[].valid includes the expiring ones, as on the Certificates page; the certificates without a CA
of this server are the entry with an empty id and name, last in the list. count of a rule is every
finding, while findings holds at most 200 per rule. key is rule: plus the ID of the subject and stays
the same between runs. href is a path inside the web UI, or empty. An id that is not one of the ten rules is
400 (bad-request, field rule); the message lists the valid ids.
The state of every rule:
curl -sS --cacert root.pem -H "Authorization: Bearer $MYOWNPKI_TOKEN" https://pki.homelab.lan:9443/api/v1/analysis | jq -c '.rules[] | {id, state}'
An output looks like this (the states depend on your installation):
{"id":"orphaned_certificate","state":"unknown"}
{"id":"duplicate_certificates","state":"ok"}
{"id":"renewal_loop","state":"ok"}
The certificates that end per week in the current week and the next 12 weeks:
curl -sS --cacert root.pem -H "Authorization: Bearer $MYOWNPKI_TOKEN" https://pki.homelab.lan:9443/api/v1/reports | jq -c '.expiry.weeks[] | {start, count, window}'
jq is only for reading the output. REST API explains tokens and
conventions, and api/openapi.yaml has the exact schemas.
Why the charts are SVG without JavaScript
The server draws the charts as inline SVG: bars and columns, with text for every label, styled by the same style sheet as the rest of the UI. There is no JavaScript on these pages and no chart library.
The reason is the Content Security Policy of the admin listener. It allows scripts, styles and images only from
the server itself and has no exception for inline code or inline style. As of this release the web UI serves no
script at all, and the repository has no step that builds one. The project plan names the chart library
ECharts, bundled with esbuild. esbuild is not an approved dependency, and a chart library’s HTML tooltip is
reported to write inline style attributes, which this policy refuses; whether the current version still does
so was not tested. Loosening the policy of a CA’s admin UI for six simple bar charts was not an option.
ECharts stays approved for a later step and is not used now. The decision is recorded in the project plan.
What you give up: hover effects, zooming and clicking a legend entry to hide a series. A bar has the browser’s
own tooltip (an SVG <title>), and the exact numbers are always in the table under the chart. What you get:
nothing that the policy can break, colors that follow the light and the dark theme (and the OS setting)
through the same tokens as the rest of the UI, and pages that work with scripts switched off. Every text that
comes from your data, such as a CA name, is cleaned of control characters, clipped and escaped before it goes
into the SVG.
Reading the charts without seeing them
- Each chart is a
<figure>with a caption and a one-sentence summary, for example how many certificates end in the current week and the next 12 weeks and how many of them in the warning or critical window. - The SVG has a title and a description for screen readers. The exact numbers are a real table under every chart, in a fold called Numbers, which a keyboard opens like any other fold.
- Every series has a text label in the legend. The second and third series of a stacked chart also have a hatch pattern, and the status colors (valid, warning, critical) always come with their words. The chart colors are tested for contrast against the background in the light theme, the dark theme and the OS-follow setting.
- Nothing is animated.
What it does not do
- It fixes nothing. Revoking, renewing and removing are the buttons and commands they always were; the findings only say where to look.
- No export (CSV or image), no date picker, no longer history than the 30 days the alerts keep, and no slice per CA or domain.
- No dismiss or acknowledge for findings, no thresholds in the configuration, and no notification from the analysis.
- No renewal heatmap and no chart of key algorithms. They were planned and are not built.
When a number looks wrong, compare it with the pages that hold the facts: Certificates with its filters for the counts, Agents for the fleet and Alerts for the history. The numbers come from the same data, so a difference is worth a report.